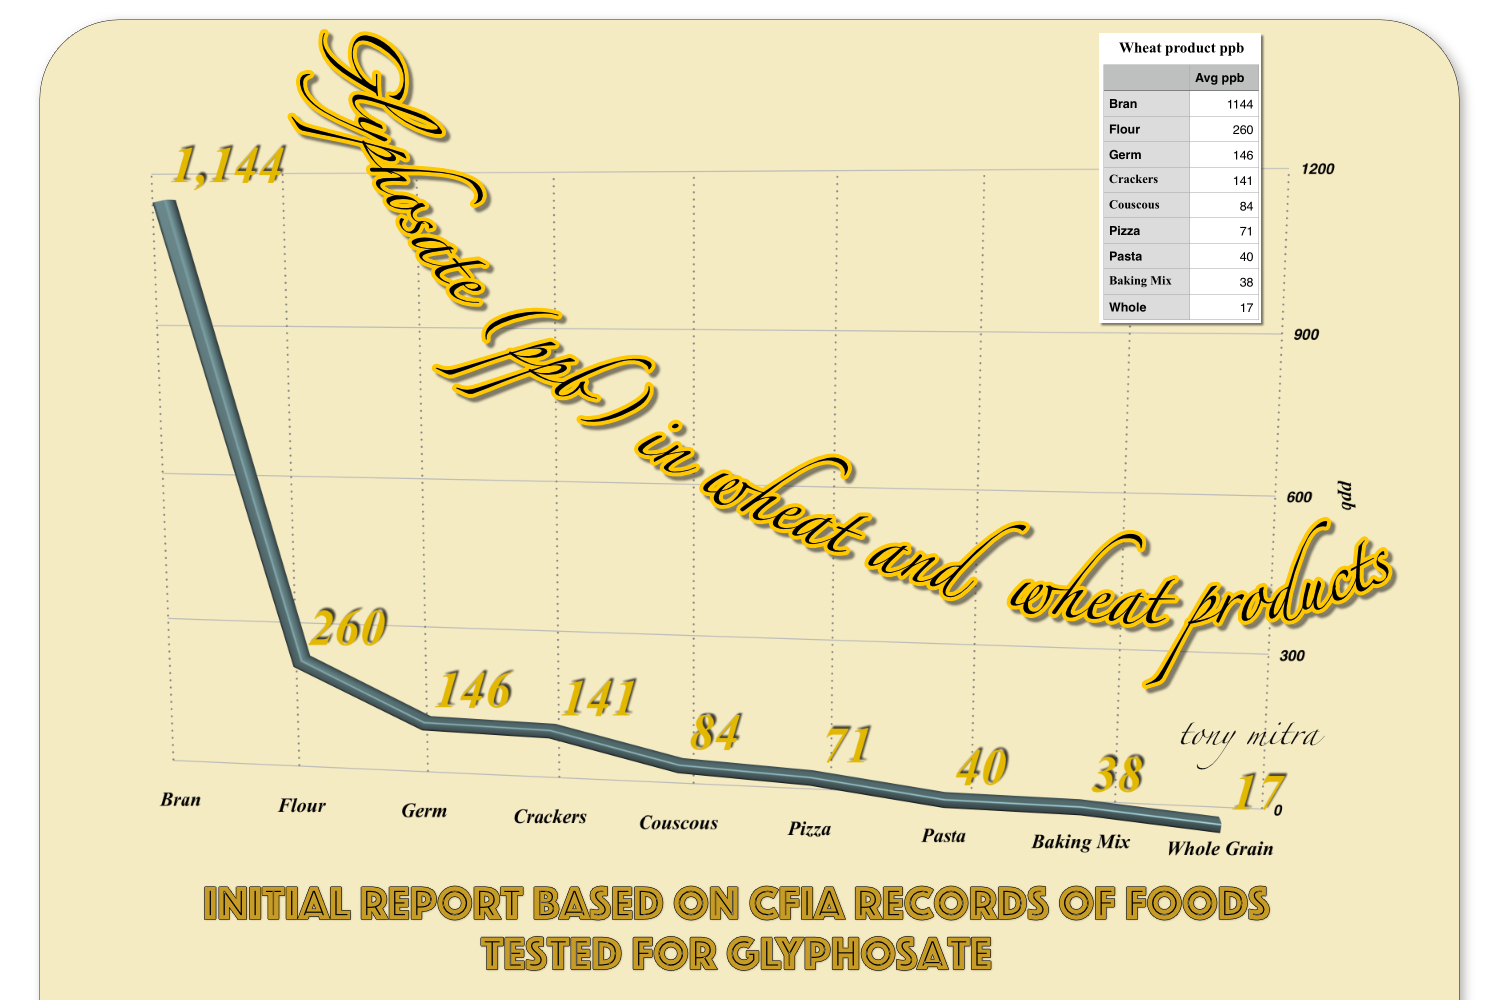
I have more or less cleaned up the 7,800 odd records received from CFIA on foods tested for glyphosate. That has brought me to study wheat products to greater detail, because wheat is regularly desiccated with glyphosate in North America and is a suspect crop to contain high glyphosate. The results of the investigation, described below, has helped me prepare two graphs. The first one is below, Graph-1, is a line diagram of average glyphosate (& AMPA) content in wheat subgroups. You can see how the figure for wheat bran goes through the roof.
Graph 1
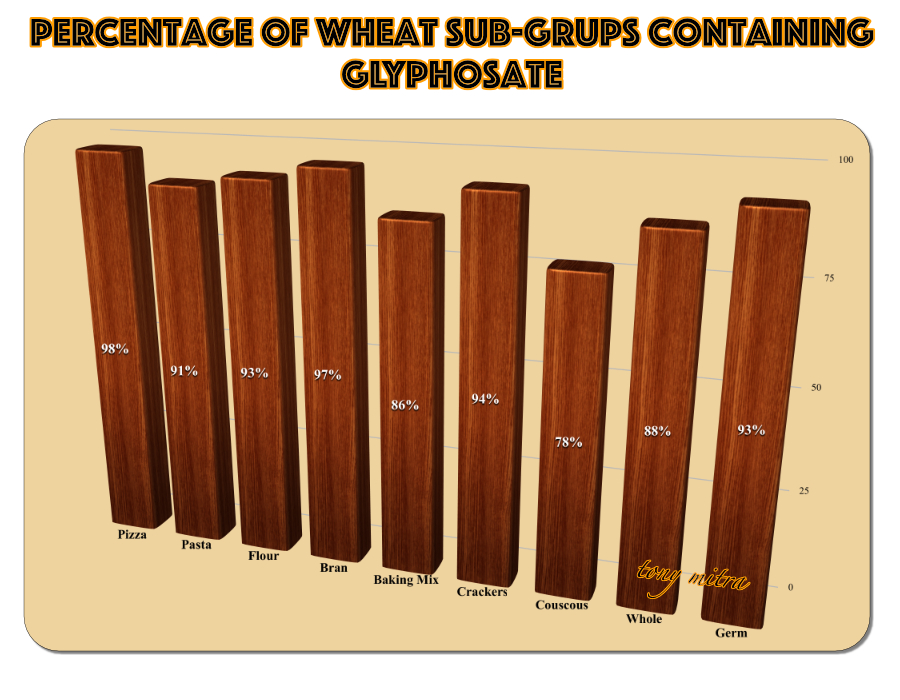
Then there is the issue of other subgroups. Although their average content appears relatively low, the view of this presenter, (tony mitra) is that no glyphosate is good glyphosate and that standard toxicology tests for glyphosate is insufficient an yardstick for assessing safety limits of glyphosate. Therefore, preference is to have no glyphosate at all. Further, effort is made here to check how many of the samples of each subgroup contain glyphosate, and for that figure, apart from average ppb limits, to be as relevant an indication. To that end, the second graph (#2) was prepared, based on below Table-D. The picture is not pretty.
Graph 2
A few unanswered question remain. These are:
- Glyphosate screening – where the result is negative or positive, but without specific µg/g concentration of AMPA or glyphosate. I suspect these screenings represented a cheaper first test and if the results are negative, then no further action is taken except recording it. For samples that have a “positive” indication, a further test, perhaps using HPLC-MSMS method, is used to measure the level of contamination. However, this needs to be confirmed with CFIA. If there is a different explanation of the glyphosate screen test, then the percentages in tis blog might change. I intend to sort that out before the book is published.
- There are a few readings of AMPA, and many more of glyphosate. It is likely that the same sample, once proven ‘Positive” was tested for both, and readings of AMPA, where noted, were included. I need a confirmation of this from CFIA. If so, the number of tests might remains same but number of samples would shrink slightly, since a few of the samples represented two test results, one for glyphosate and one more for AMPA. This will likely reduce the “dirty” percentage, since there are now a slightly lower number of dirty samples. On the other hand, it would increase the average ppb content since the total ppb or glyphosate and AMPA wold now be divided by a lesser number of samples.
- With regard to wheat and wheat products, I have a major question and concern – there seem to be no test of standard bread. Since wheat readings are comparatively bad, with a lot of the products having glyphosate, and since wheat is a major ingredient in bread making, I am baffled by the omission of testing bread. I intend to try and find out from CFIA what the reason might be, for not testing bread.
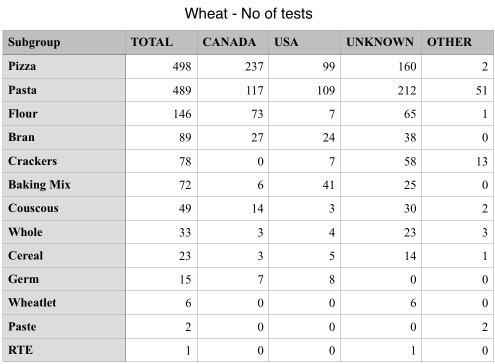
Table-A
Table-A gives the number of tests done on wheat, broken down into some of the common subgroups. More than a thousand tests are represented in the above table. Some of the readings may not be fully correct, such as RTE (ready to eat – meals) since the description of the item is not too indicative if wheat is an ingredient or not. However, for the rest of the groups, the numbers should be more representative.
The fact that “unknown” Category represents such a large volume of tests has been a source of vexation for me. I suspect these are likely almost all of Canadian origin, though perhaps procured in bulk without a container or a label marking the country of origin, and hence entered as unknown by the CFIA staff. Therefore, to make better sense of the breakdown based on regions, I am going to place unknown together with Canada and call it Canada+ in these studies.
Regarding other regions away from North America, only one subgroup item, Pasta, has a reasonable number (51). So that one might be analyzed to see if Pasta coming from overseas is any better than local produce. That is not yet covered in this blog.
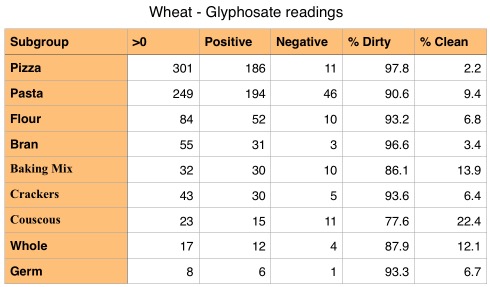
Table-B
Table-B shows how man of the tests for some of the subgroups had a reading above zero, how many of the screenings showed positive, how many negative, and the percentages of clean and dirty results. Since I assume (to be confirmed) that the ‘positive’ results of the more economical ‘glyphosate screening’ tests have been followed up with further and more expensive tests for the concentration, these were ignored, while the negative results where counted, for the percentages. Thus, the total number of samples were those of the first (>0) and third (negative) column. Thus, the percentage of dirty samples for pizza would represent the ration of 301 to (301+11), or 97.8%. This too might alter a bit after cross checking ore details from CFIA, especially about AMPA readings.
However, one can already guess that the general readings for wheat products are really bad with regard to glyphosate contamination.
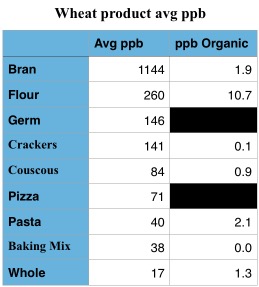
Table-C
Then comes the next table, Table-C, at left, with blue headers. This gives the average ppb figures of glyphosate (& AMPA) for each subgroup. As you can see, the numbers for Wheat Bran has gone through the roof. I should be checking with some experts on this, but suspect the reason for this to be that the best sink for the desiccated glyphosate is the outer layer of the wheat, i.e. the bran, and thus it is here that most of the glyphosate resides. The numbers fall off sharply in flour and germ. I am a bit puzzled by the reasonably low figure of whole wheat grains (bottom most item), and wonder if that because it includes items that are not really whole grain, but misrepresented or misunderstood by me. I should be looking into it further.
How about organic?
The last column in Table-C (ppb Organic) shows the basic difference between conventional or organic. Bran is a good example. Average ppb overall is over a thousand, but for its Organic variety, the average is just 1.9. In comparison, Organic wheat flour (10.7 ppb) does not fare as well, though it is still a lot lower than standard wheat flour. An so the list goes. Two subgroups, Wheat Germ and Pizza, did not have a single organic sample, therefore its ppb glyphosate for the organic label could not be calculated, and has been blacked out.
But the issue of bran really stands out. Since a lot of bread are made of bran, and because bran has been a preferred source of nutrient for some due to its high fibre content etc, and absence of bread as a tested group is more vexing. Table-D is based on the last but one column of Table-B.
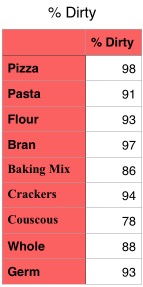
Table-D
And that brings up the this last table with red headers, showing what percentage of which subgroups of wheat contain glyphosate. As one can see, most all of the subgroups have almost 90 percent or above tests proving presence of glyphosate, with the exception of couscous, which has around 80% samples contaminated. This, along with Table-C, also tells you that, for Wheat Bran, near hundred percent (97%) contains glyphosate and average doze of the poison is over a thousand. In short, there is virtually no way one could avoid high glyphosate dose if one consumes Wheat bran.
These last two tables form the basis for the first two graphs. The picture is not pretty.
Thanks for watching and sorry for bringing you gloomy news. I am merely a messenger, and have gone through considerable difficulties to get hold of the raw data from CFIA.
tony mitra